DS-BL
SPI vs NDVI for pricing a drought index insurance product
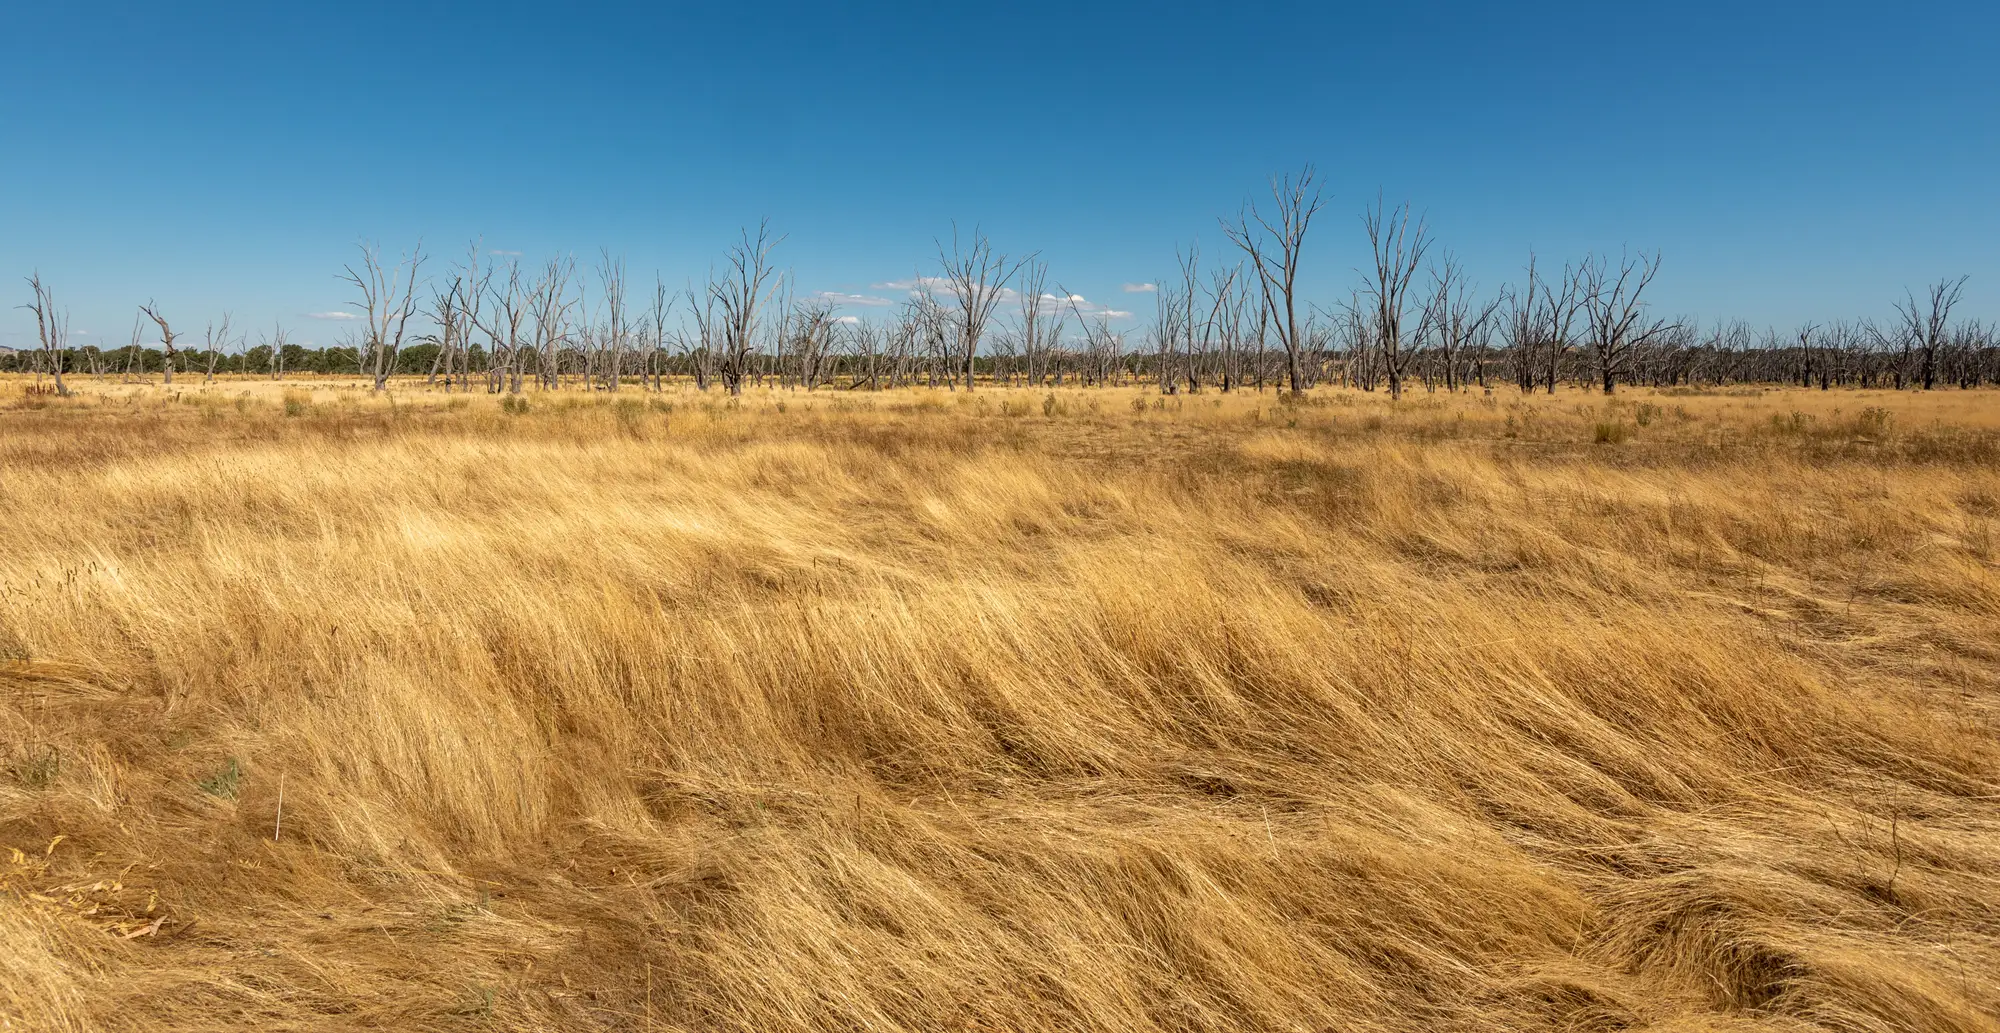
Most drought index products get built on one of two measurements: the Standardized Precipitation Index, derived from rain gauge or reanalysis rainfall totals, or a vegetation index like NDVI, derived from satellite reflectance. Both can anchor a trigger. They fail in different places, and that matters more at pricing time than at launch.
What each index measures
SPI measures rainfall deficit against a historical distribution for that location and time window. It tells you how dry the sky has been. It says nothing about whether that rain deficit actually hurt the crop or the rangeland. A dry spell that lands during dormancy, or that gets offset by stored soil moisture from a wet prior season, can produce a low SPI reading with no real loss on the ground. Underwriters who have priced rainfall index products know this gap by its working name: basis risk, and it's the single biggest source of disputed payouts.
NDVI measures the plant's actual photosynthetic response, greenness relative to a baseline for that pixel and that month. It captures the outcome of the water stress rather than the rainfall event itself. That's closer to what a loss looks like on the ground. The tradeoff is that NDVI picks up stress from causes that have nothing to do with drought: hail, flooding that drowns roots, pest pressure, even a field that got switched to a different crop rotation. A clean vegetation anomaly needs a baseline long enough to separate normal seasonal variation from a real deficit event, and a region small enough that the anomaly isn't diluted by mixing stressed and unstressed land in the same polygon.
Where each one breaks down for pricing
Rainfall index products price cleanly because the actuarial record goes back decades at most gauge stations, and the statistics are well understood. The problem shows up at claims time, when a policyholder with a visibly brown field points to a station thirty kilometers away that recorded normal rainfall for the month. That gap between the measurement point and the insured area is the thing you're pricing blind if you only have SPI.
Vegetation index products price against a shorter reliable satellite record, and the anomaly has to be computed consistently, same sensor characteristics, same baseline period, same regional boundaries, every month, or your severity bands drift under you from one renewal to the next. The upside is that the anomaly sits right over the insured polygon rather than thirty kilometers away at the nearest gauge.
A lot of books end up running both. SPI sets the rainfall-driven trigger because the actuarial history supports it. A vegetation index anomaly confirms or adjusts the payout because it reflects what happened to the crop. That combination also gives you a cleaner story for reinsurers asking how you controlled basis risk, since you can point to a ground-truthing layer that doesn't depend on gauge density.
Building the vegetation side into a pricing file
If you're adding a vegetation anomaly to a book that currently runs on rainfall data alone, the practical question is whether you can get a consistent monthly read, region by region, against a baseline long enough to mean something. A baseline built on a handful of seasons will flag ordinary variation as severe drought one year and miss a real event the next, because there isn't enough history to know what normal looks like for that region.
Drought Monitoring computes a vegetation index anomaly every month against a multi-decade baseline, region by region, and exports it as a CSV or a map layer you can drop into a pricing model built for measured triggers rather than last season's rainfall total. The output is an anomaly value and a severity classification per region, the same two numbers you'd want sitting next to your SPI series when you're deciding where the strike and exit points belong.
If your current trigger logic stops at the rain gauge, it's worth seeing what a region-level vegetation anomaly adds to the file before the next renewal cycle.