DS-BL
Same dry spell, different severity calls: notes from two adjacent basins
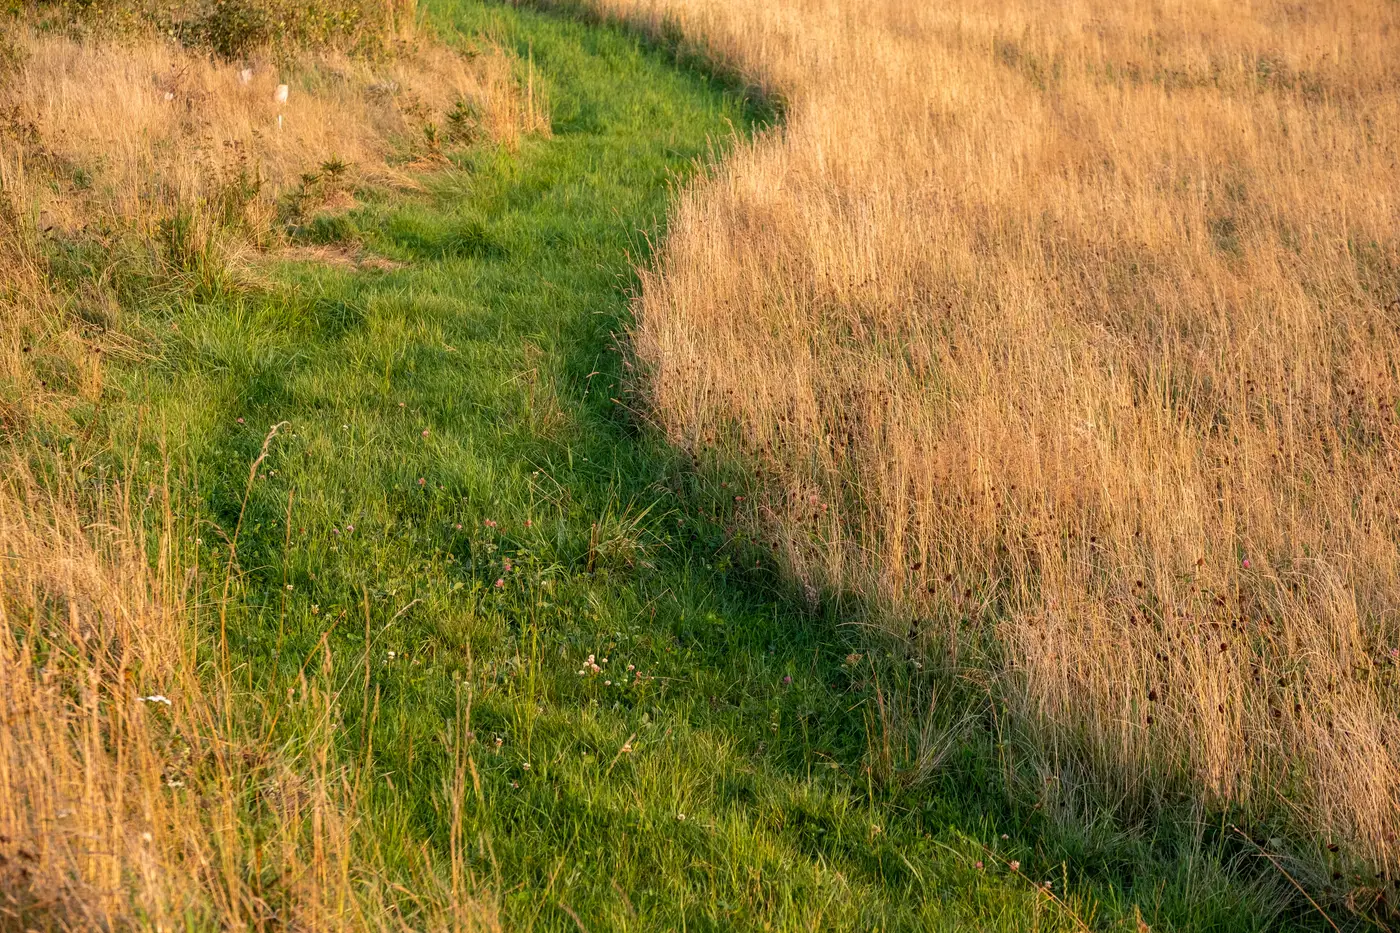
Pull up a regional anomaly export from any dry month and you'll find pairs like this: two basins sharing a border, both under the same ridge of high pressure for six weeks straight, both reporting below-normal rainfall to the nearest met station. One comes back moderate. The other comes back severe. Nothing in the weather record explains the gap. The explanation is in the vegetation, and it's worth sitting with for a minute because it's the whole argument for pricing off a measured index instead of a rainfall total.
Start with what the two basins actually grow. A region running mostly deep-rooted perennials, tree crops, established pasture, can coast through four or five dry weeks on stored soil moisture before the canopy shows it. A region next door running shallow-rooted annuals, especially anything recently planted or recently harvested and replanted, shows stress within days. Same rain deficit, completely different vegetative response, because the plants aren't drawing from the same depth.
Then there's the baseline itself. The anomaly gets measured against that specific region's own multi-decade NDVI record for that specific month, not a generic normal. A basin that runs consistently lush in September, because it always has, drops further below its own baseline than a basin that runs consistently sparse in September and was already close to its floor. The second basin can look fine on paper simply because there's less room to fall. An analyst reading only the headline rainfall deficit would call these two regions the same, but the one reading the anomaly against each region's own history sees that the lush one took the real hit.
Irrigation infrastructure does the rest of the work. One basin on canal or groundwater supplementation can mask a rainfall deficit for a month, sometimes two, before the index catches up to what the ground report would have said anyway. The neighboring basin with no irrigation access shows the stress immediately. If your trigger logic treats both regions as a single zone, you're either paying out on the irrigated basin too early or sitting on your hands for the rainfed one too long. Neither is a good place for a book to be.
This is the part that doesn't show up in a rainfall bulletin, and it's the reason a single ground report from one farm, or one district office, doesn't generalize across a boundary line that was drawn for administrative reasons and not agronomic ones. A dry spell is a single meteorological event. Severity is a biological response to that event, filtered through soil depth, crop stage, rooting pattern, and whatever water infrastructure sits under the canopy. Two regions can share the storm and not share the damage.
Rainfall still matters here as the cause. The index is the measurement of the effect, and that's the part worth pricing. The two basins in this scenario would get different severity classifications on a monthly vegetation index readout, and that's not a contradiction to resolve. It's the whole point of running the comparison region by region instead of writing one trigger for a zone that was never agronomically uniform to begin with.
If there's a lesson for anyone setting trigger thresholds this season, it's to resist the instinct to smooth two neighboring regions into one number because the map makes them look close together. Pull the anomaly for each one separately, check what it's doing against its own baseline, and let the gap between them tell you something instead of averaging it away.
Run your own regions against their baselines before you lock next season's thresholds.